Powin Data Visualization

Cover for Cell Vendor Report

Powin is a global market leader in the energy storage industry. As the company continues to grow, visualization and data design is instrumental in assuring investors and internal stakeholders of who they are and where they should head.

Businesses are built on persuading people—but not just end-users, patients, or customers. No, successful businesses must convince internal stakeholders, leaders, and investors, too. As such, research, data, and information become tools that build cohesion and confidence because they are measured against viability and accuracy.

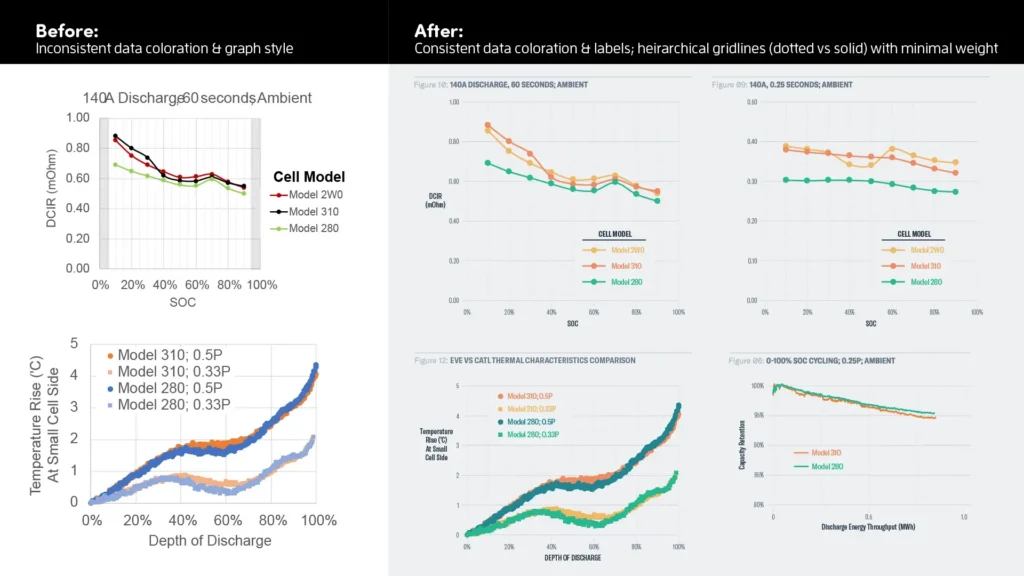
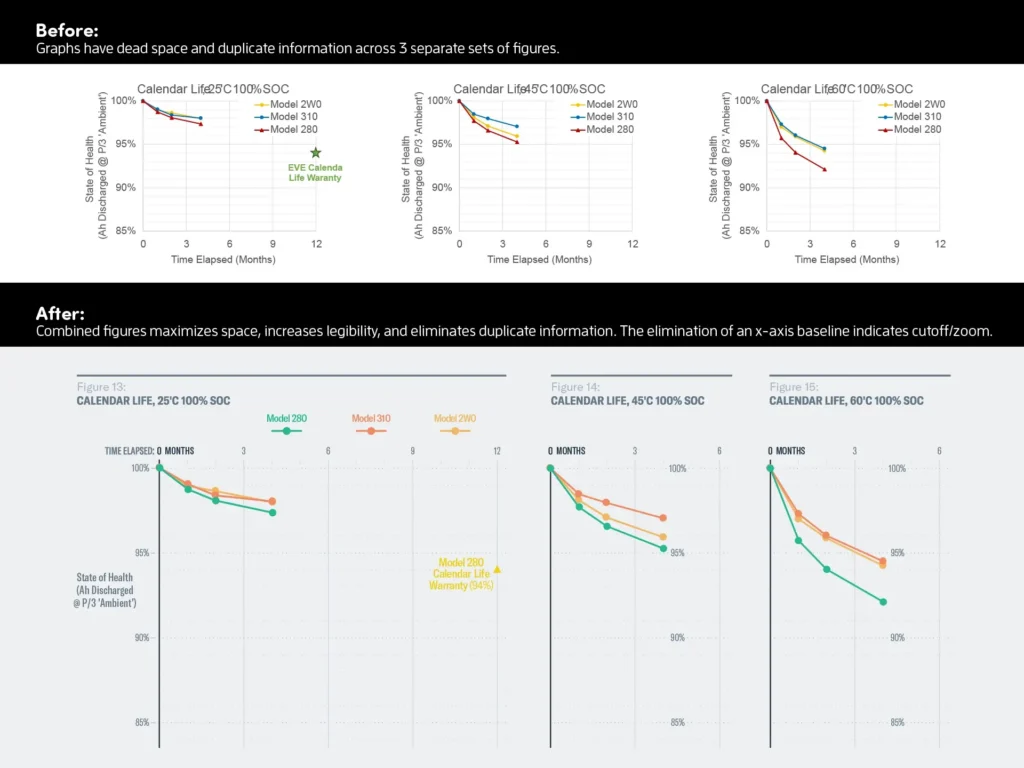
I believe that the presentation of information—how it is delivered, what it looks like, and why it’s important—is the difference between success and failure. If data is confusing, unclear, or cluttered, it’s harder for your audience to pick up what you’re putting down. The two projects presented here showcase the importance of good information design.

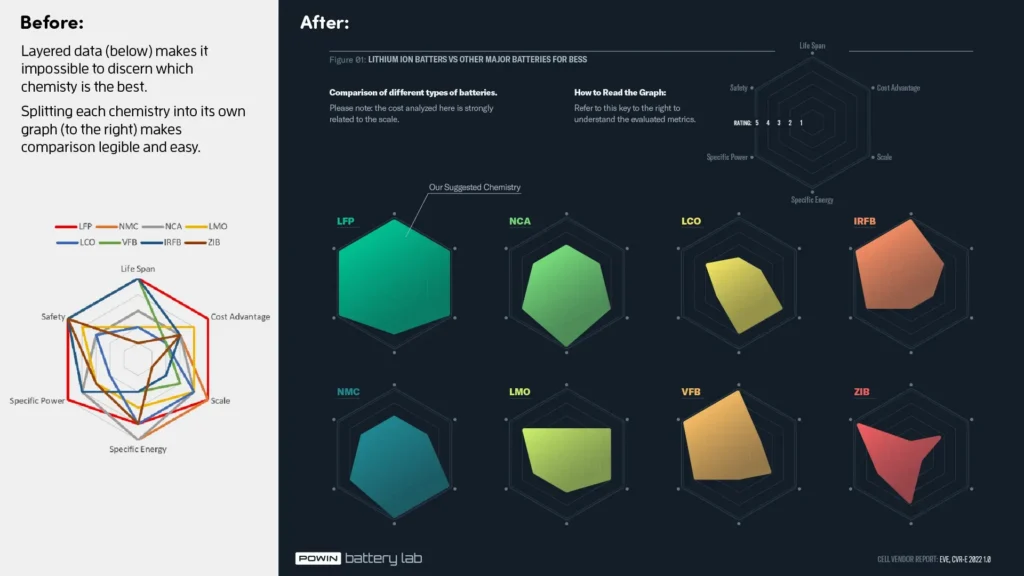
The Cell Vendor Report here includes research data collected by Powin’s Battery Lab. This sub brand of Powin needed a logo and guiding design aesthetic. Indigo, cool greys, and condensed font styles differentiate this report from the standard Powin brand. These tweaks fit with the more scientific nature of their work.

Powin battery chemistry comparison figure
Battery chemistry comparison figure

Properly designed, data becomes more effective at persuading. These four principles guide how data should be designed:

  1. Simplicity
  2. Data first
  3. Color consistency
  4. Universal scale

Persuasive visuals are governed by legibility. When I received from Powin the figure above, all eight chemistry rankings were layered into one hexagonal graph. The overlapping data impaired readability. To correct this, I split the figure into eight separate graphs. This made LFP’s superiority to other chemistries immediately obvious. By adding a key, I avoided redundant information and preserved simplicity.

Powin battery performance data

When I say “data first,” I mean that the data is the first thing we see. Graph lines are grayed or simplified so that the dominant information jumps right out at you. In this way, we guide the eye to what we want it to see: the data! Programs often output data with heavy black lined grids and thick lines, which makes reading a graph difficult. Tweaking these design elements and placing labels inside the graph means the eye isn’t forced to search as much.

These graphs compare the performance of different cell models. Data was recolored so that each cell model was only represented in one color throughout the entire report. Whenever we see green, it is the EVE cell model. Keeping color consistency makes the reader’s job easier and frees thinking space to focus on what’s important.

Powin battery performance data

Lastly, universal scale means that the grid size is consistent. Figures 13, 14, & 15 (above) demonstrate the advantages of maintaining scale across multiple graphs. Visual noise is reduced by aligning y-axis and x-axis lines of multiple graphs on the same page.


Powin Bankability Report

This corporate overview is aimed at investors. The above title slides and cover give readers a sense of the aesthetic, which draws from Powin’s branding. The “Corporate History” diagram below showcases the thin linework and condensed fonts used to convey precision and technology.

Powin business model

The three slides above are key in quickly explaining Powin’s competitive differentiators. Instead of using a simple bulleted list, I developed icons and diagrams to add interest and depth. The “Business Model” diagram especially helps demonstrate how Powin controls a far greater portion of the manufacturing chain than its competitors.

Powin corporate history

In a week, I turned engineering 3D data into the product render shown below. To go from engineering drawings to in-situ photograph-like visuals used to be impossible. Today’s tools help us communicate so much quicker and keep visuals accurate to the latest designs. This is key when trying to sell your ideas!

Powin Stack 750E

Using visuals to accompany information makes content more understandable and interesting. Each slide uses maps to ground the information. Keeping fonts and colors simple and uncluttered maximizes legibility and speaks to the reliability of this brand.

Powin market expertise
Powin supply chain

Fin.